Effective Debugging for Shopify Hydrogen/Oxygen
Effective debugging is essential for Shopify Hydrogen to minimize development time and significantly enhance performance, reliability, and user experience. Shopify Hydrogen comes equipped with various debugging tools, such as an error console, subrequest profiler, and a GraphQL query editor. When used alongside best practices and supporting services, these tools can substantially shorten the debugging process for a Hydrogen app.
The Error Console
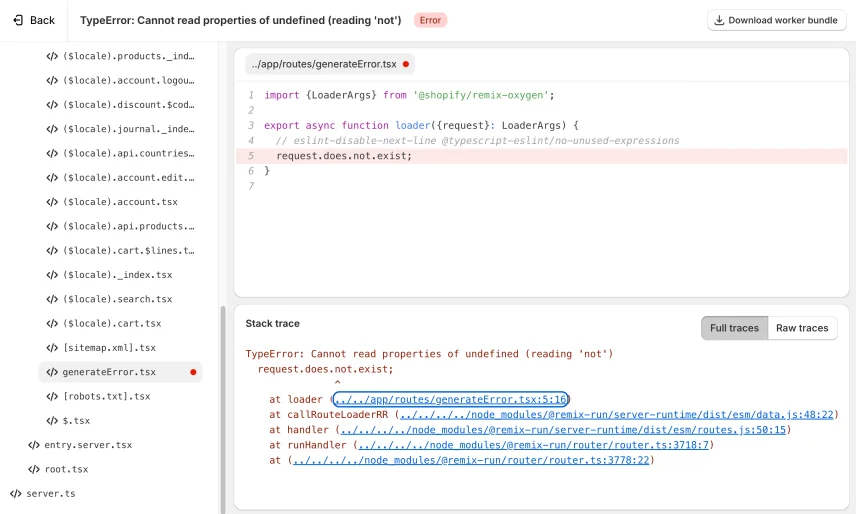
The Error Console, distinct from the browser's console, activates when running a local development instance and is also available for apps deployed to Oxygen. To access the error console for a deployment, click on any error in the runtime log on its deployment detail page. The error console highlights the line causing a server error and allows exploration of the complete source code of the deployed worker bundle. It requires a source map file, which the Hydrogen CLI generates by default when running the build command.

Subrequest Profiler
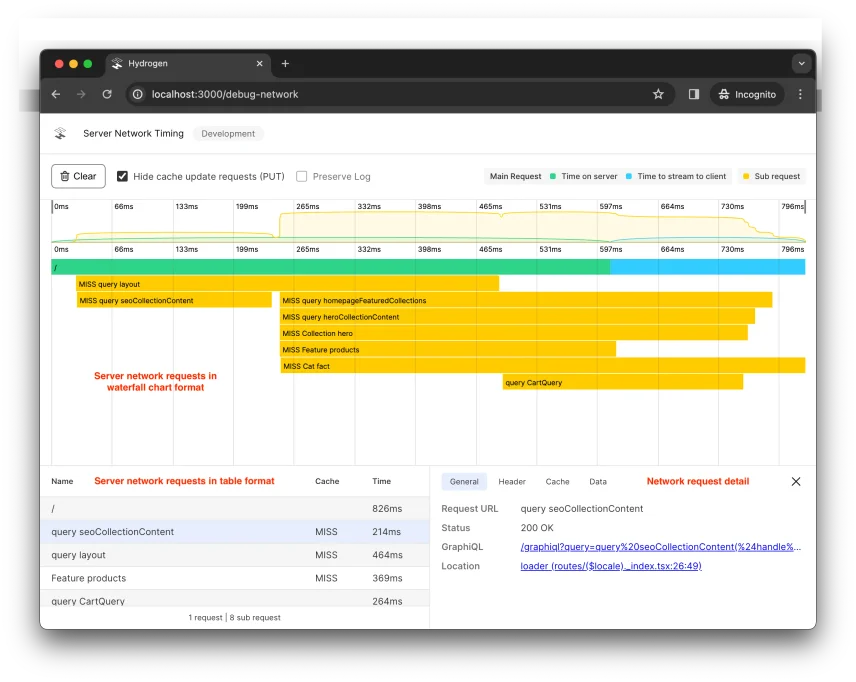
The Subrequest Profiler, which Shopify provides locally, is incredibly useful for inspecting server-side network requests using Hydrogen's Subrequest Profiler. This tool helps diagnose network and cache performance issues on the server side and is accessible at the /subrequest-profiler route when spinning up a local instance. It includes a waterfall chart and a table of server-side network requests, as well as a network request details panel that provides detailed information for selected requests, such as response headers, cache status, and response data.
GraphQL Explorer
Additionally, Hydrogen spins up a local GraphiQL explorer to help create queries and learn about Shopify's Storefront API. To use the editor, you need to set three environment variables:PUBLIC_STORE_DOMAIN PUBLIC_STOREFRONT_API_VERSION PUBLIC_STOREFRONT_API_TOKEN
Log Drains
Shopify also offers the ability to easily integrate log drains, enabling merchants to send a copy of their logs to a supported destination of their choice, such as Splunk Enterprise, Datadog, and New Relic.In addition to these tools you can use a Debugger
Visual Studio Code Node Debugger
Visual Studio Code has built-in debugging tools. These tools offer an integrated environment where developers can set breakpoints, step through code, and inspect variables in real-time, all within the same interface they use for writing code. This seamless integration eliminates the need to switch between different tools, reducing context switching and potential errors.